Least-Squares Regression
|

|
About
Topics
- Linear Regression
- Correlation
- Residuals
- Outlier
- Data
Description
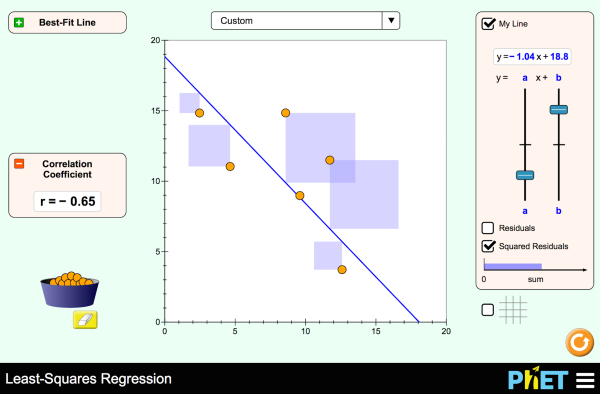
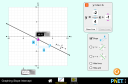
Create your own scatter plot or use real-world data and try to fit a line to it! Explore how individual data points affect the correlation coefficient and best-fit line.
Sample Learning Goals
- Interpret r (the correlation coefficient) as data points are added, moved, or removed.
- Interpret the sum of the squared residuals while manually fitting a line.
- Interpret the sum of the squared residuals of a best-fit line as a data point is added, moved, or removed.
- Compare the sum of the squared residuals between a manually fitted line and the best-fit line.
- Determine if a linear fit is appropriate.
For Teachers
Teacher Tips
| Overview of sim controls, model simplifications, and insights into student thinking ( PDF ). |
Teacher-Submitted Activities
| Title |
|
|
Authors | Level | Type |
|---|---|---|---|---|---|
| Alignment of PhET sims with NGSS |
|
Trish Loeblein | HS | Other | |
| How do PhET simulations fit in my middle school program? |
|
Sarah Borenstein | MS | Other | |
| CCSS Math Alignment with Sims |
|
Amanda McGarry | K-5 MS HS |
Other | |
| Correlation vs Causation | Andy Braaten | HS UG-Intro |
Lab | ||
| PhET Simulations Aligned for AP Physics C | Roberta Tanner | HS | Other | ||
| MS and HS TEK to Sim Alignment | Elyse Zimmer | HS MS |
Other | ||
| Preguntas de razonamiento para todas las simulaciones HTML5 |
|
|
Diana López | K-5 MS Grad HS UG-Intro UG-Adv |
HW Discuss |
Translations
Related Simulations
Software Requirements
| Windows 7+ | Mac OS 10.7+ | iPad and iPad Mini with iOS | Chromebook with Chrome OS |
|---|---|---|---|
|
Microsoft Edge and Internet Explorer 11, latest version of Firefox, latest version of Chrome.
|
Safari 9+, latest version of Firefox, latest version of Chrome.
|
Latest version of Safari
|
Latest version of Chrome
|
Credits
| Design Team | Third-party Libraries | Thanks To |
|---|---|---|
|
|