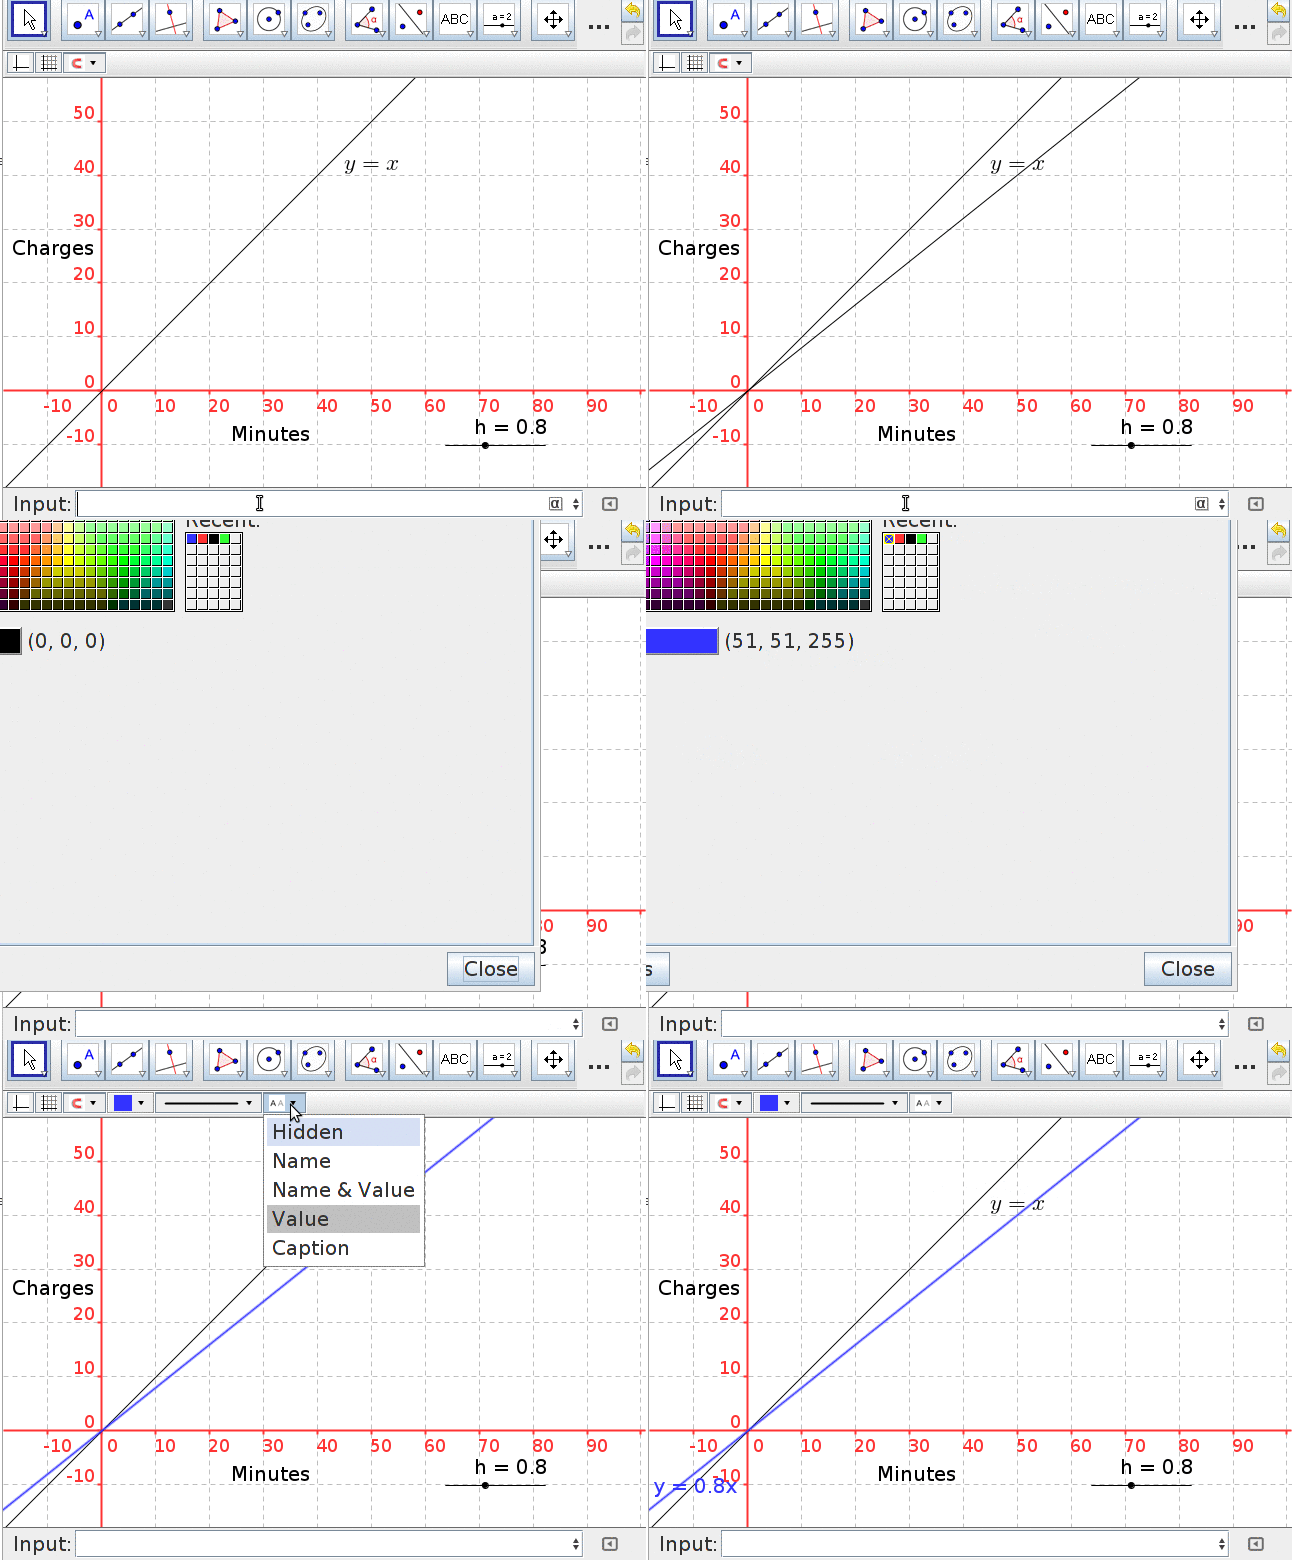
administrator > page > Plotting_Graph > Plotting graph using values from the table is show below. Values on x axis represents time in minutes and values on y axis represents charges in rupees. a. Plot the points. b. Draw a line passing through the given points. Adding slider By moving the slider, we can compare the cost effectiveness of plans easily. Exporting graph Saving graph [Contributed by administrator on 2. Mai 2025 04:59:28] × Tags No tags defined yet! Views Show no. of views Programs
Values on x axis represents time in minutes and values on y axis represents charges in rupees.
a. Plot the points.
b. Draw a line passing through the given points.
Adding slider
By moving the slider, we can compare the cost effectiveness of plans easily.

Exporting graph
Saving graph